An engineering consultancy had over 50 years of data in offices across Australia. When they saw opportunities, they had to scramble to try to find and use their data effectively. Often, by the time the data was ready to be accessible, understandable and usable, the opportunity had expired.
Discovery
Defining & aligning

There were numerous attempts by stakeholders who tried to solve this problem internally, but who could not agree to each other’s solutions.
Their daily commitments also did not allow for the time and effort needed to develop their ideas. Luckily they reached out externally for help.

1. Defining perspectives
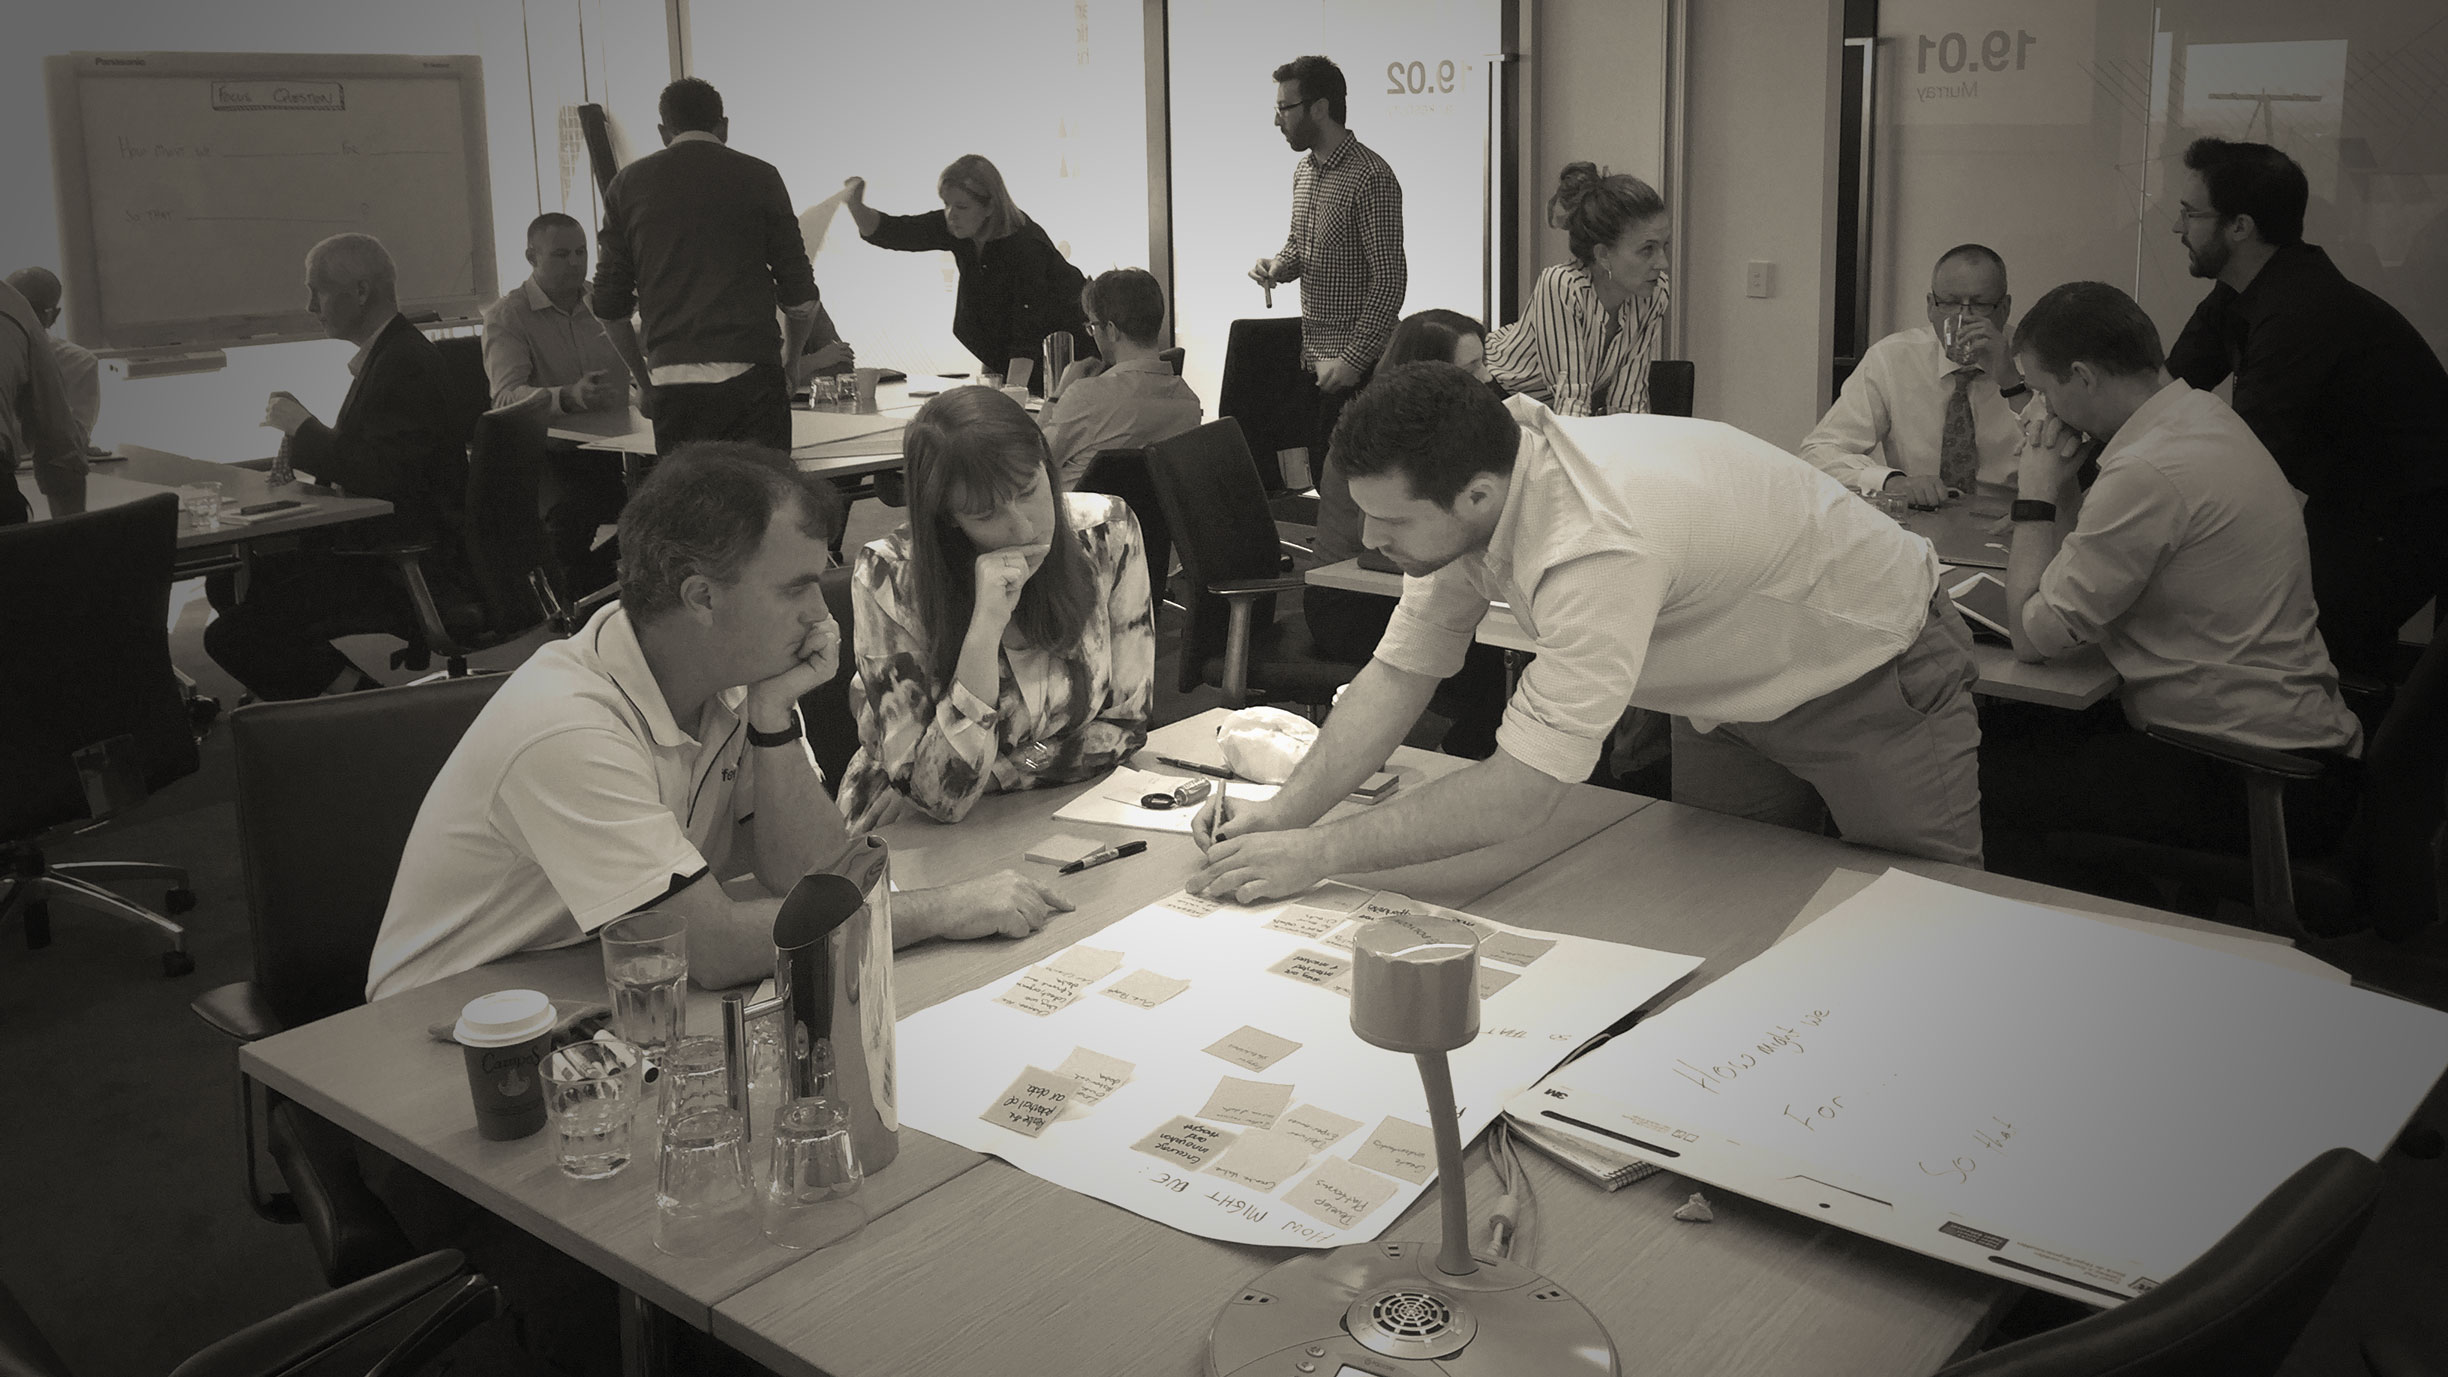
A 2-day workshop was arranged with the National Heads as stakeholders to draw out what they perceived as problems and solutions.
These activities allowed individuals to define challenges and their definitions of success.
The difference in stakeholders’ success criteria was made explicit so that everybody could understand them, even if they did not agree entirely with each other at first.

2. Sharing perspectives
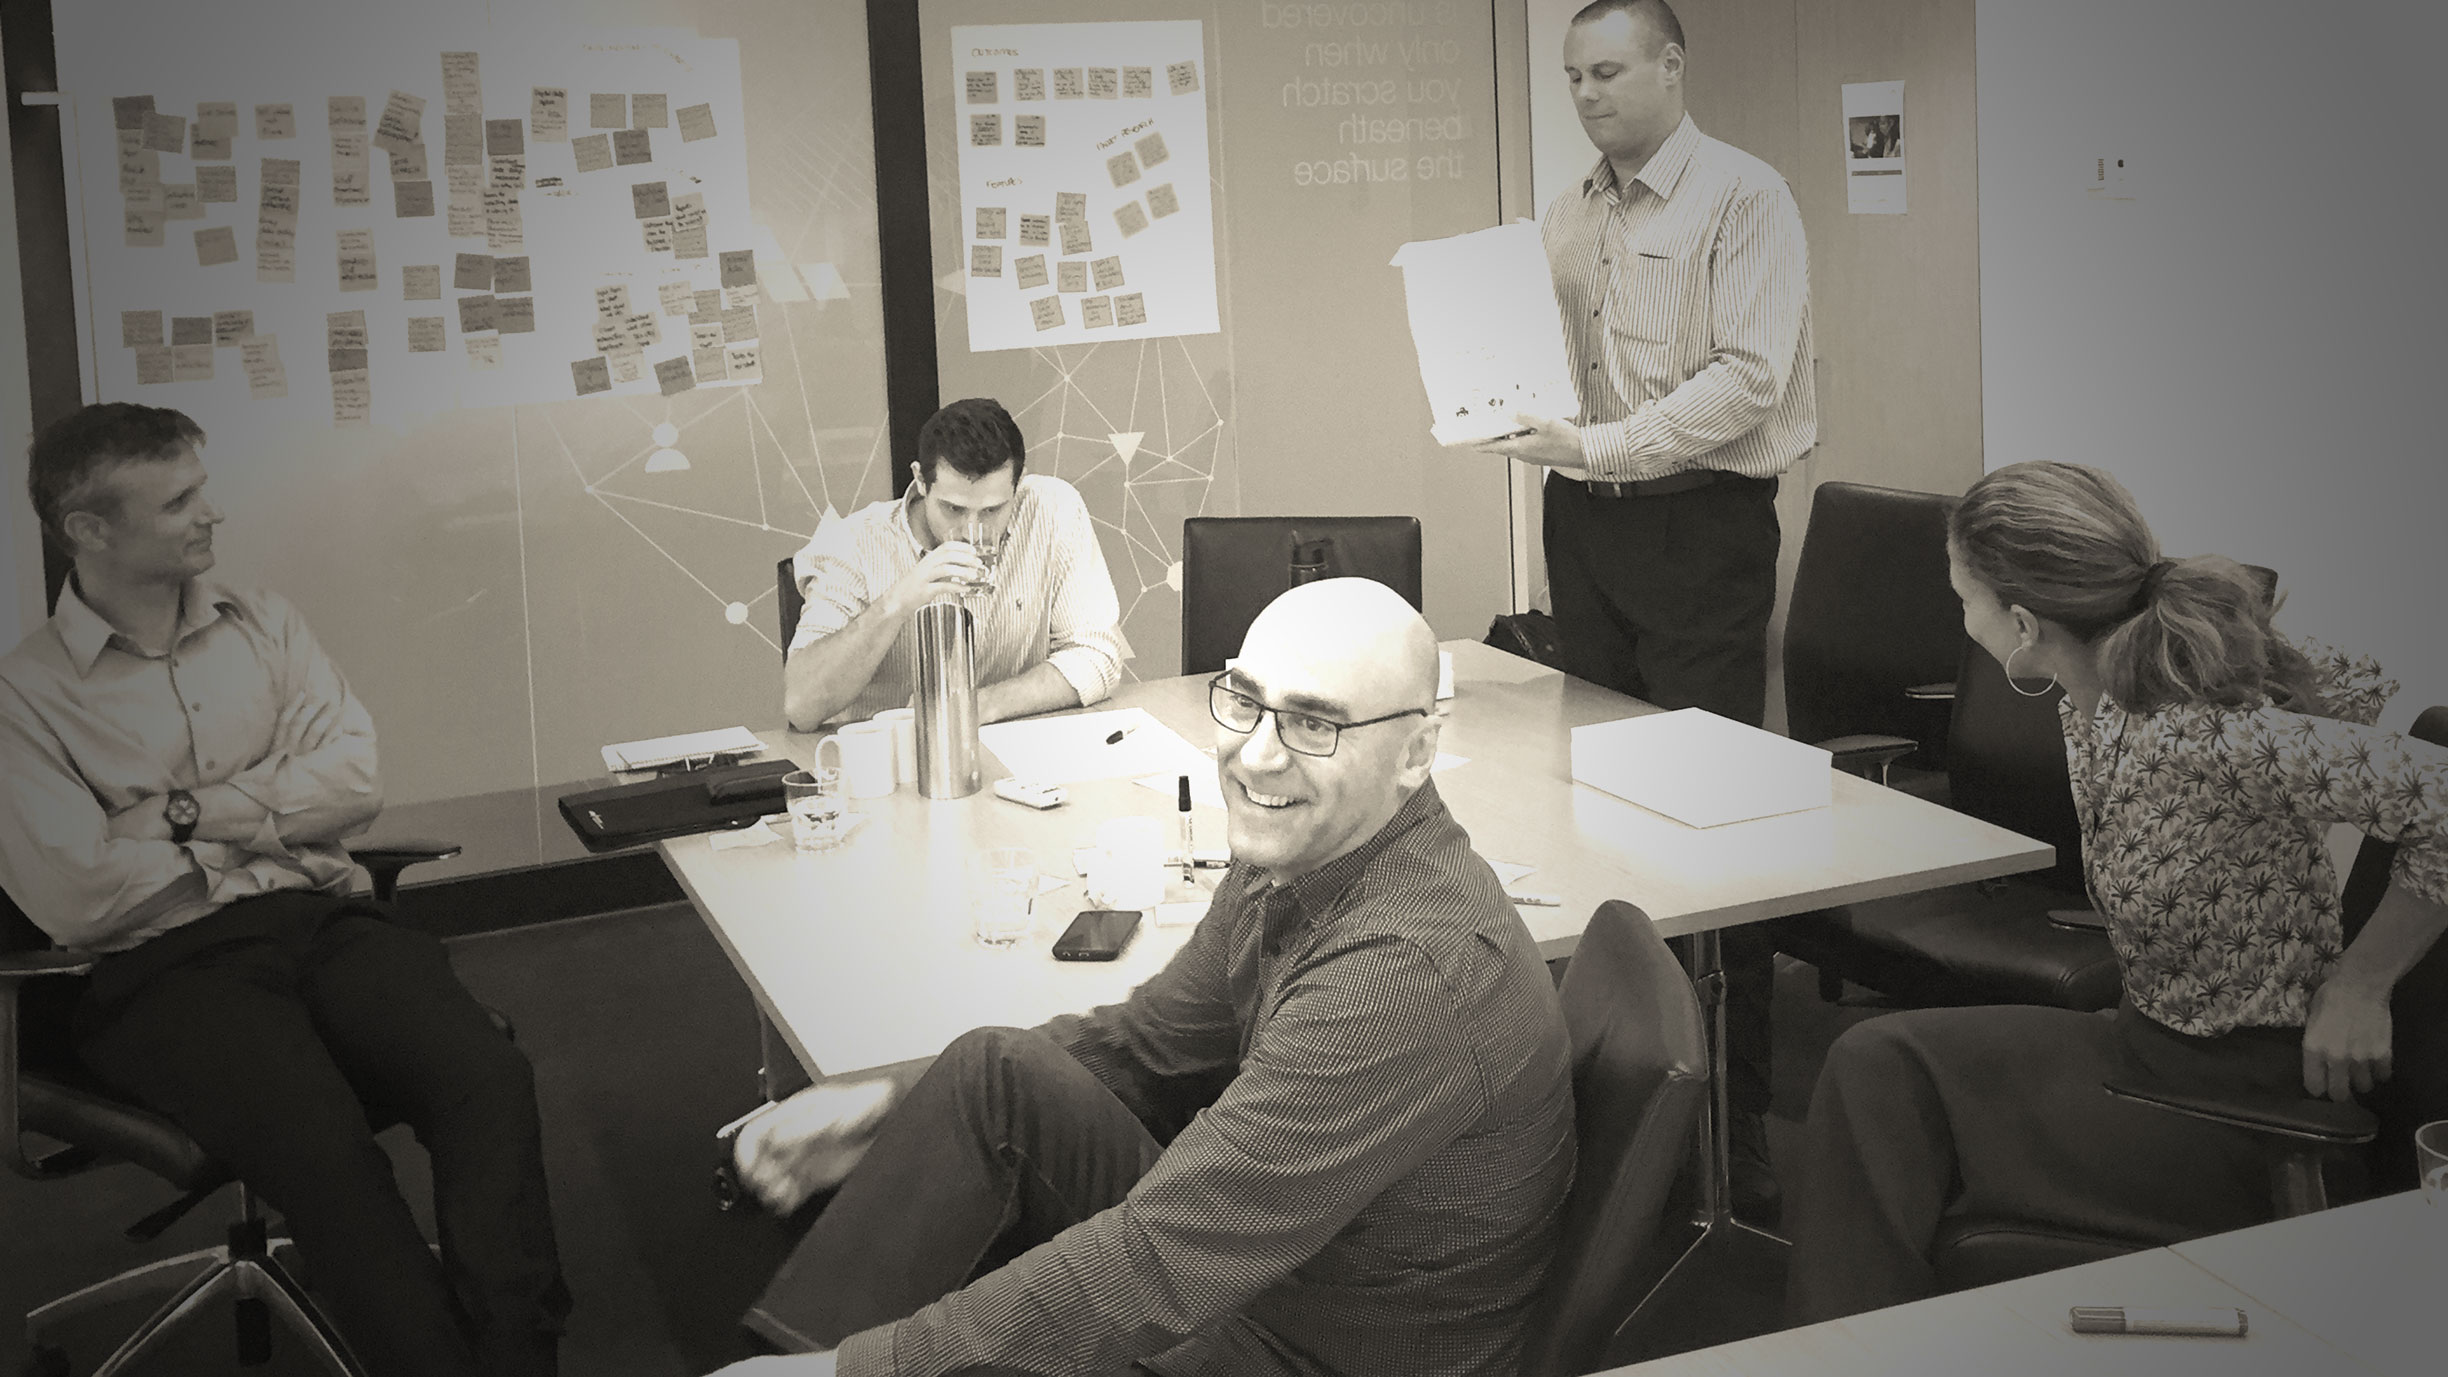
We used “Design-the-Box” as a creative group activity to allow people to give their solutions a name, detail features and describe how they might solve the problem.
Each group presented their ideas to each other and voted for the best ideas and why the features were more valued than others.
This allowed a playful way to share each other’s perspectives and open mindsets to discuss collective benefits.

3. Aligning visions
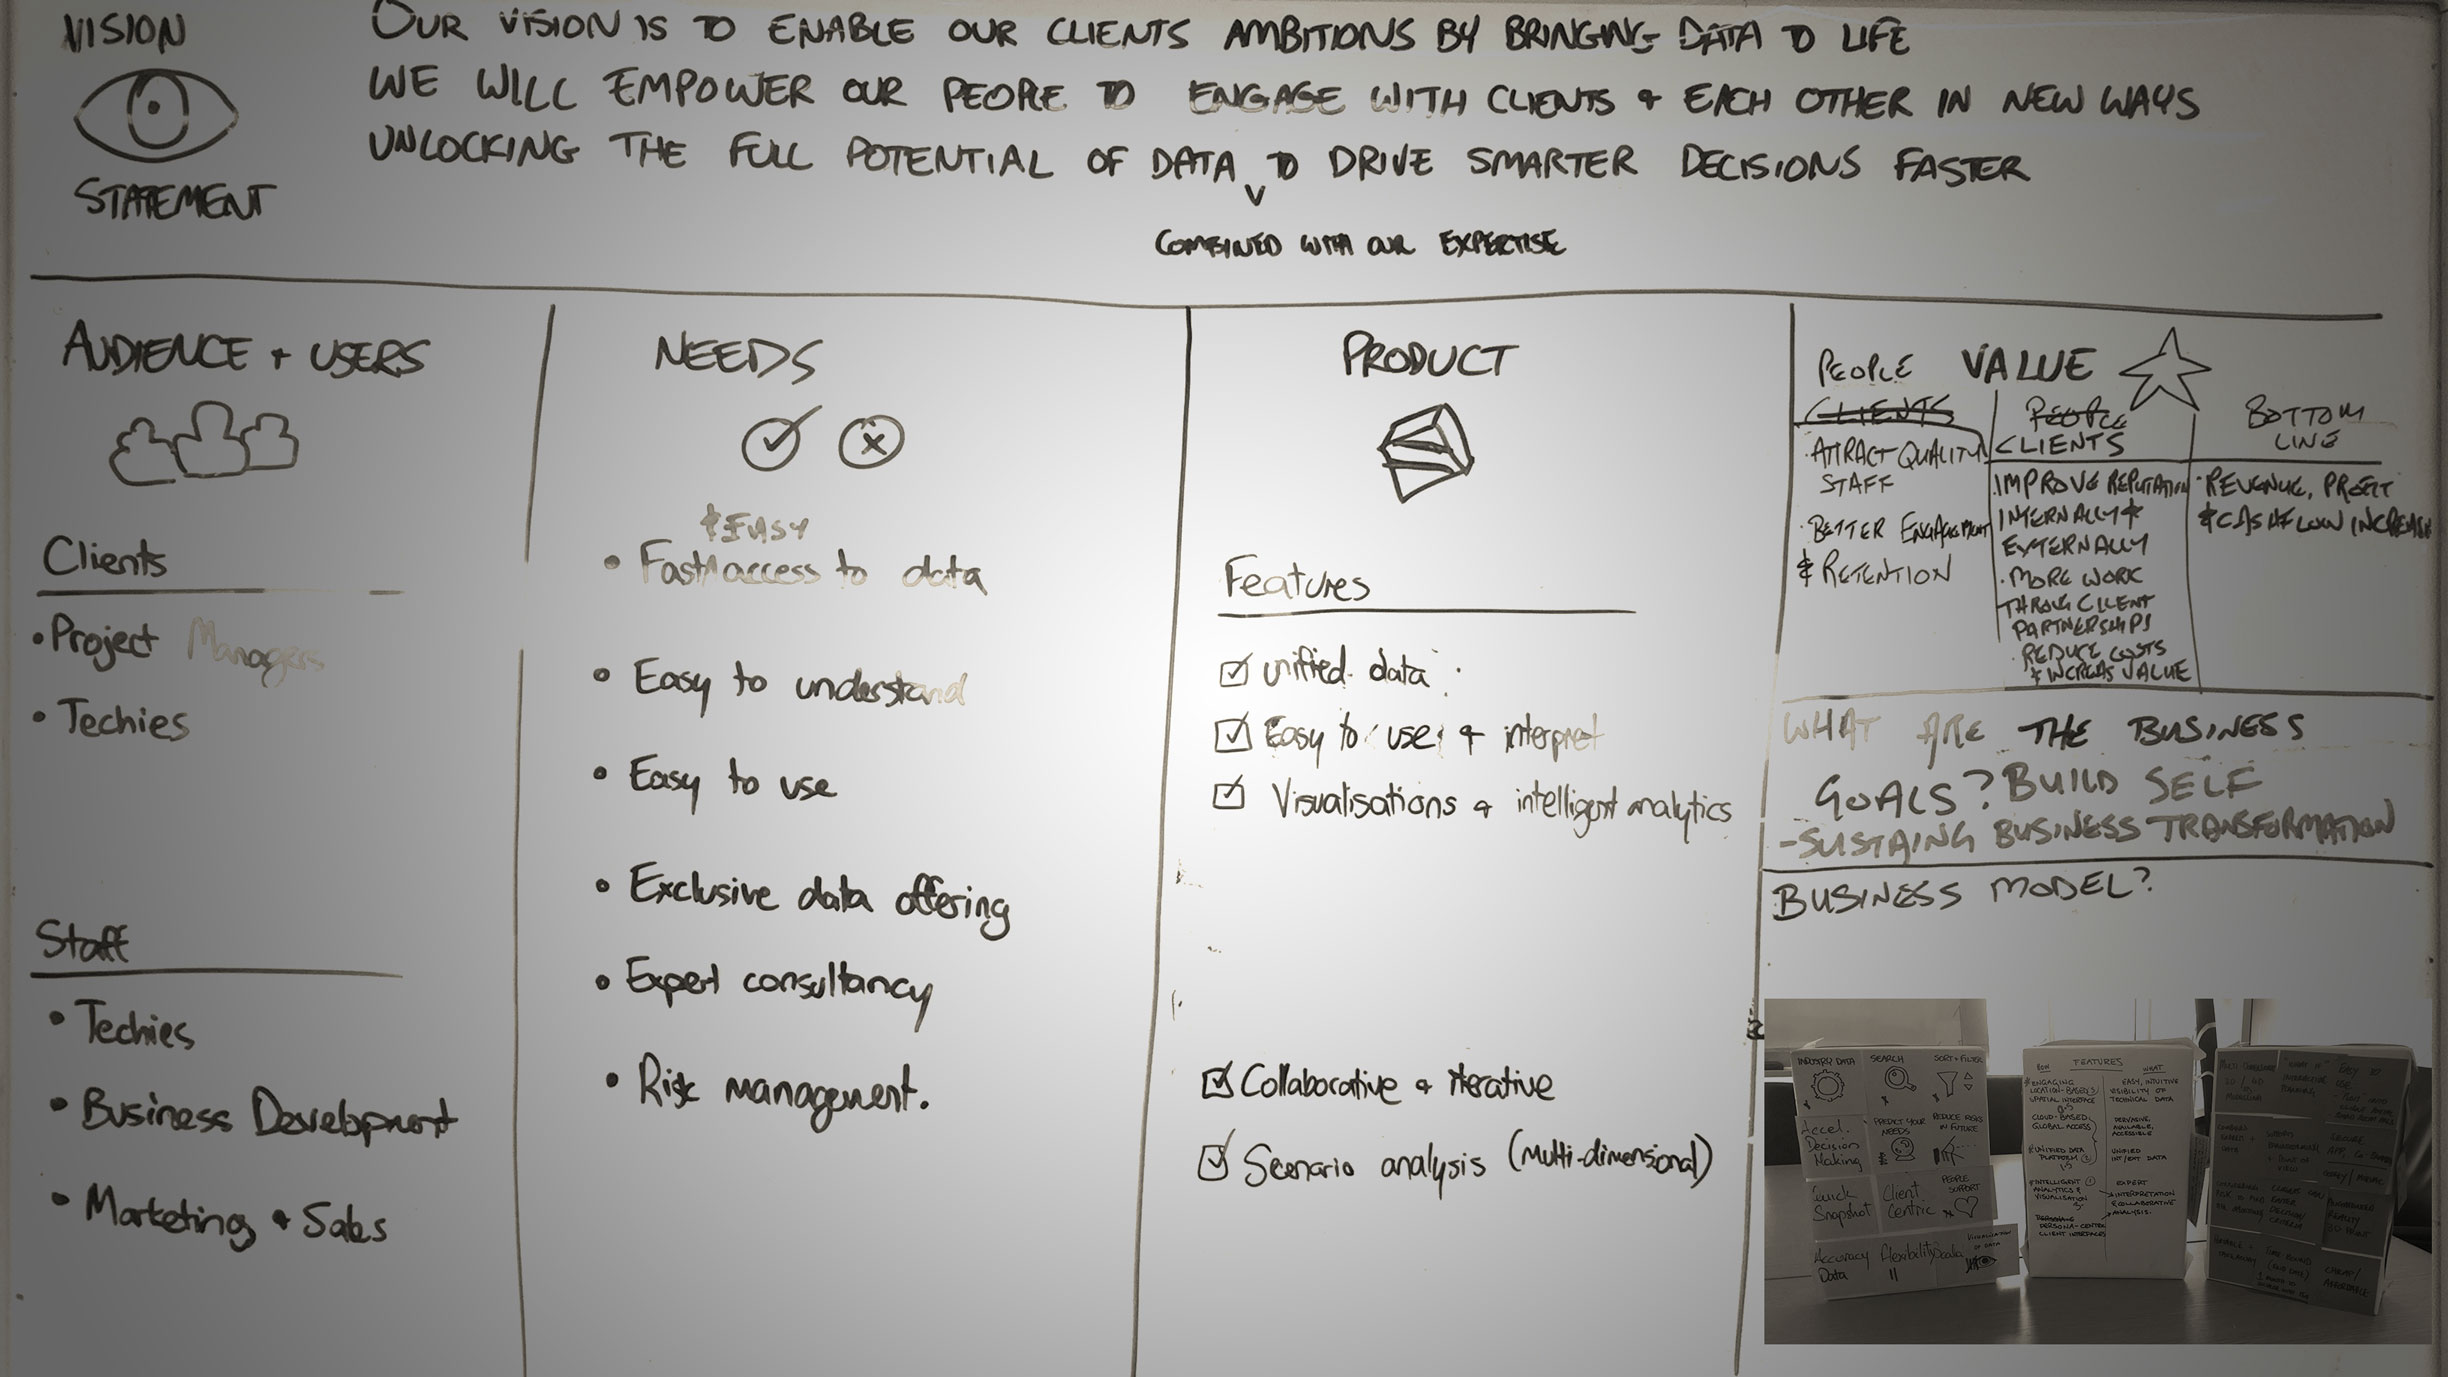
Once problems and solutions were shared and understood, the final exercise was to define a collective vision, who it aimed to solve the problem for and define the outcome achieved in a simple statement.
We used a tool developed by Roman Pichler called the Product Vision Board. The Product Vision Board helps to describe, visualise, and validate the product vision and strategy.
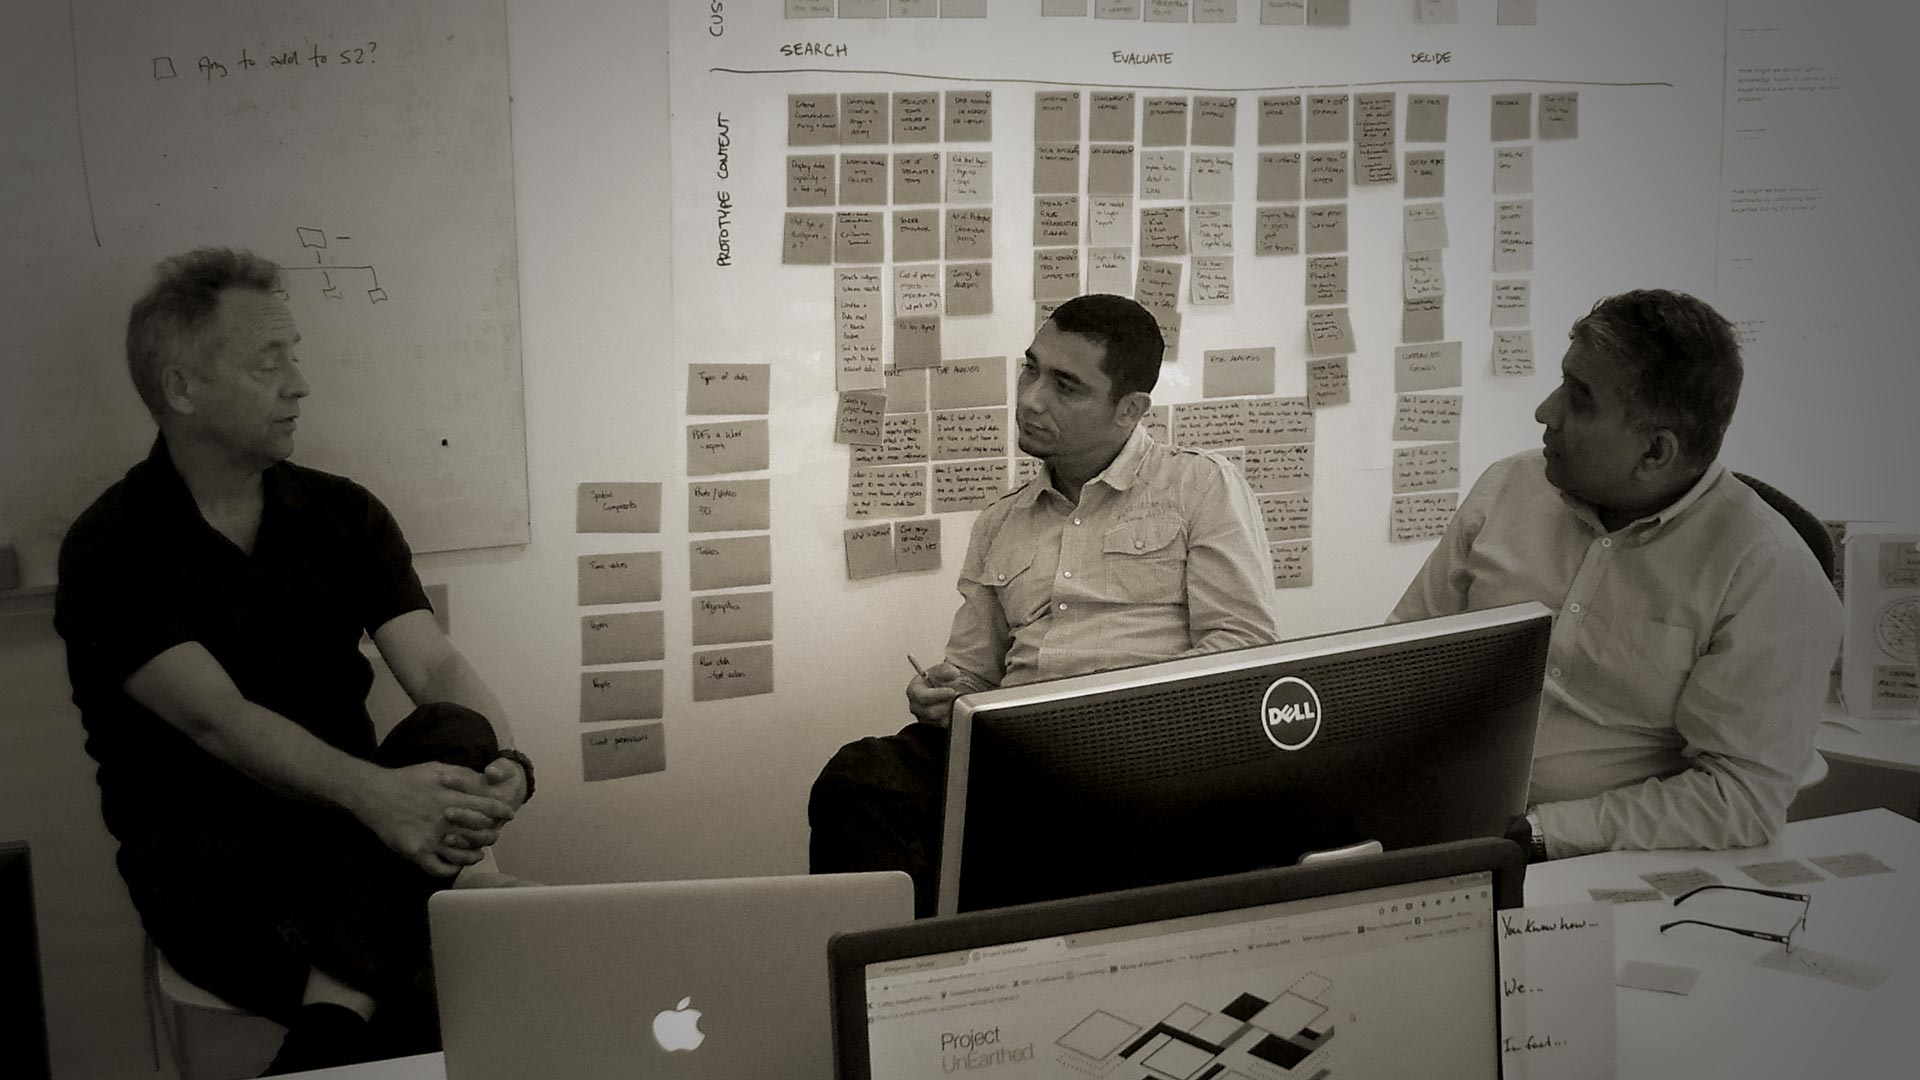
Building the agile team
We formed a multi-disciplinary team including client managers, geotechnical engineers, flying their 2 developers from the UK and a couple of visual designers. We all worked from a dedicated space to enhance communication and focus attention to working on the same project with minimal interruptions.
User research
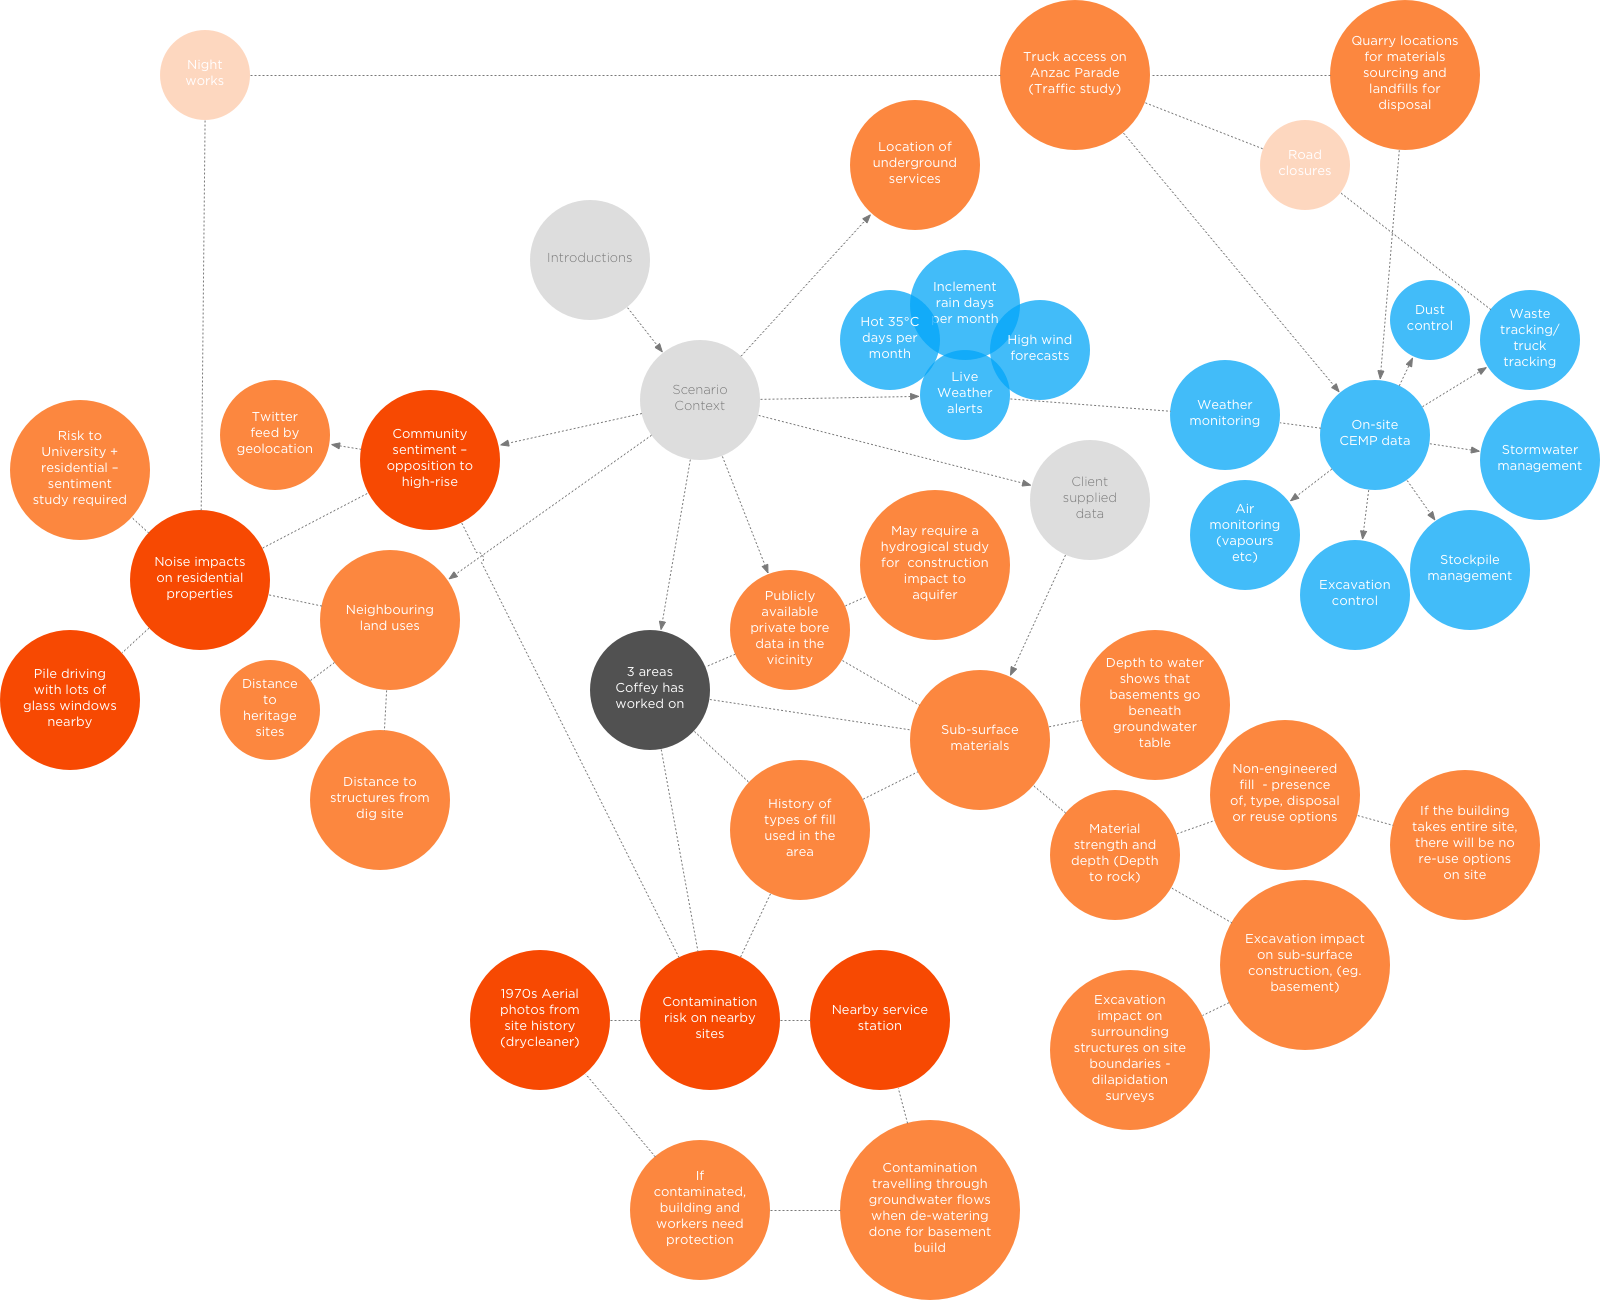
Discussion Guide Map
Discussions can be fluid and not linear. This map helps keep track of the areas to cover during conversation and the relationship of topics.
Client and Audience needs


The primary activity involved undertaking user research by mapping what the client engagement managers knew about their clients’ profiles, needs and existing experiences.
Customer Persona Archetypes
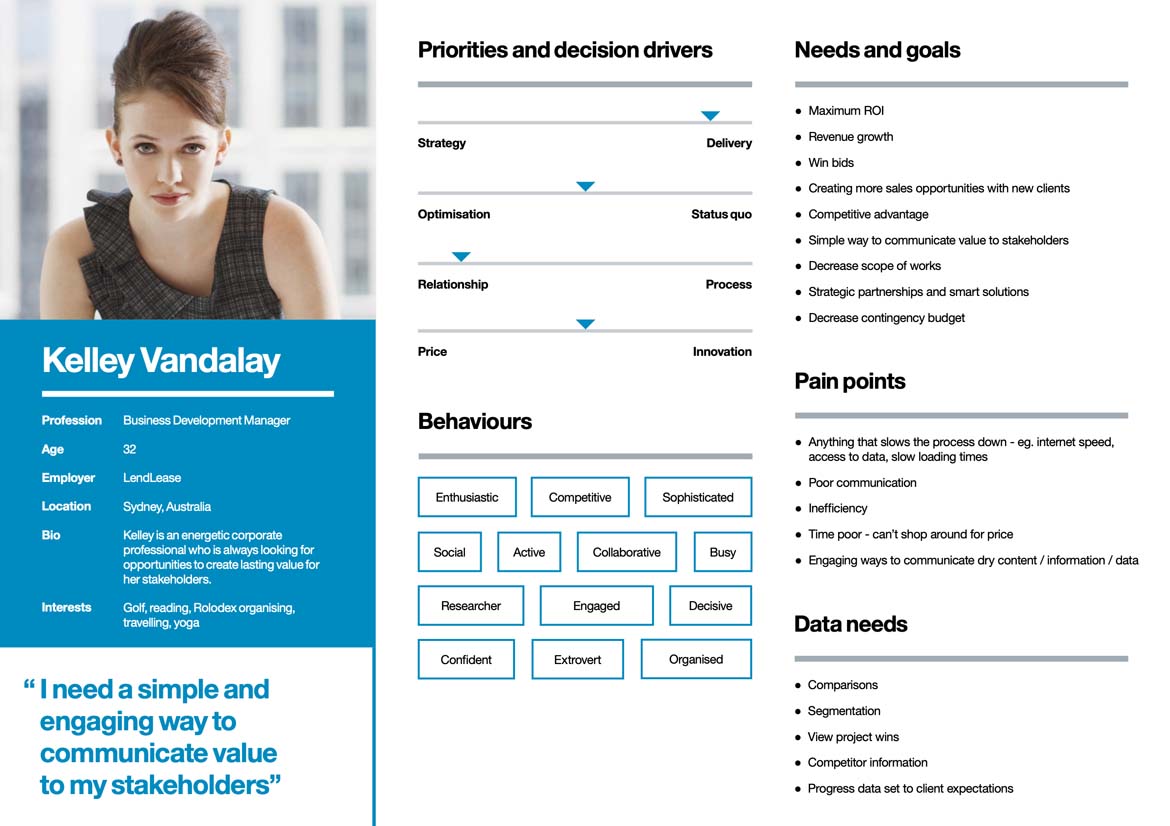
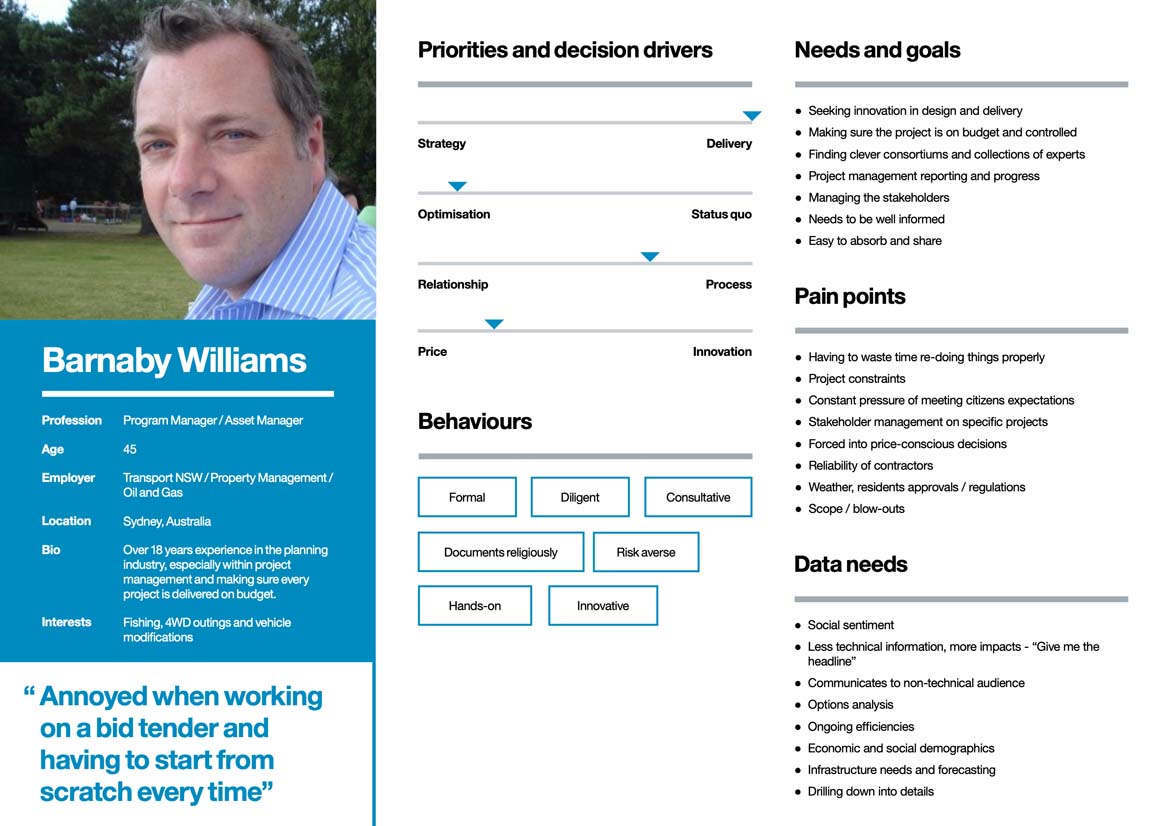
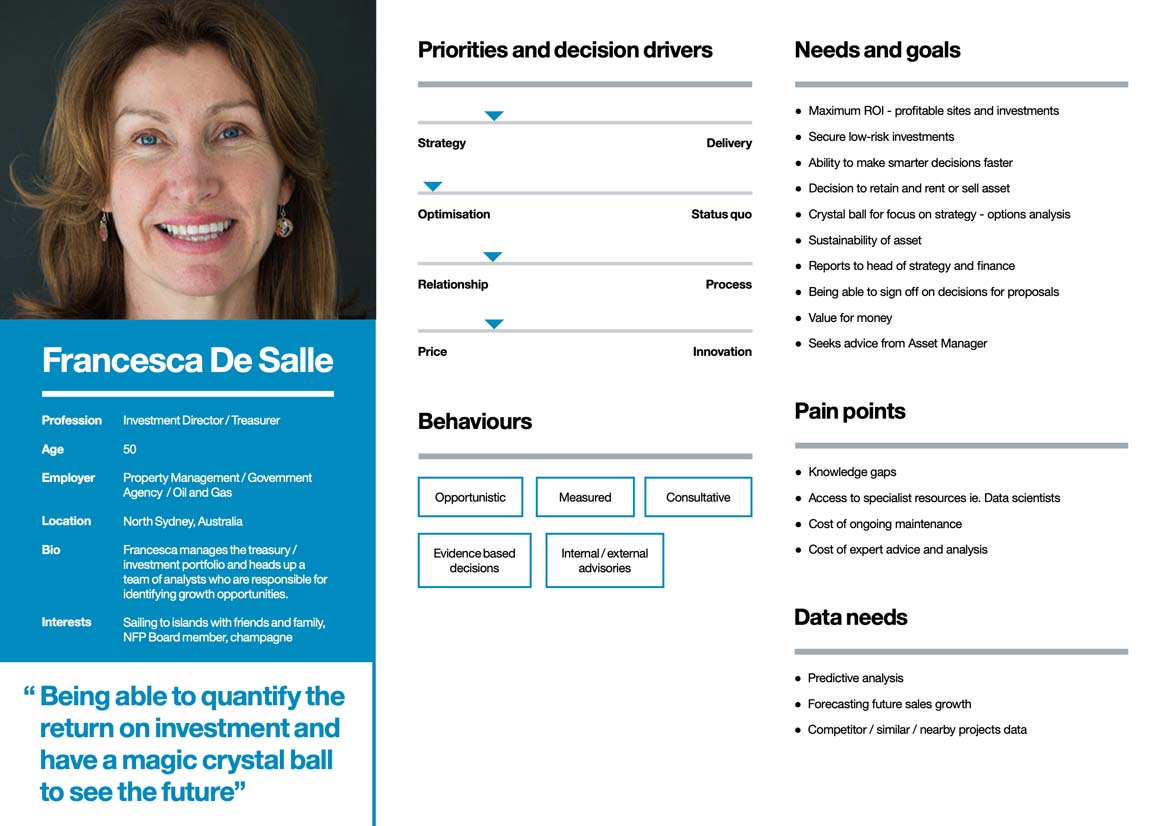
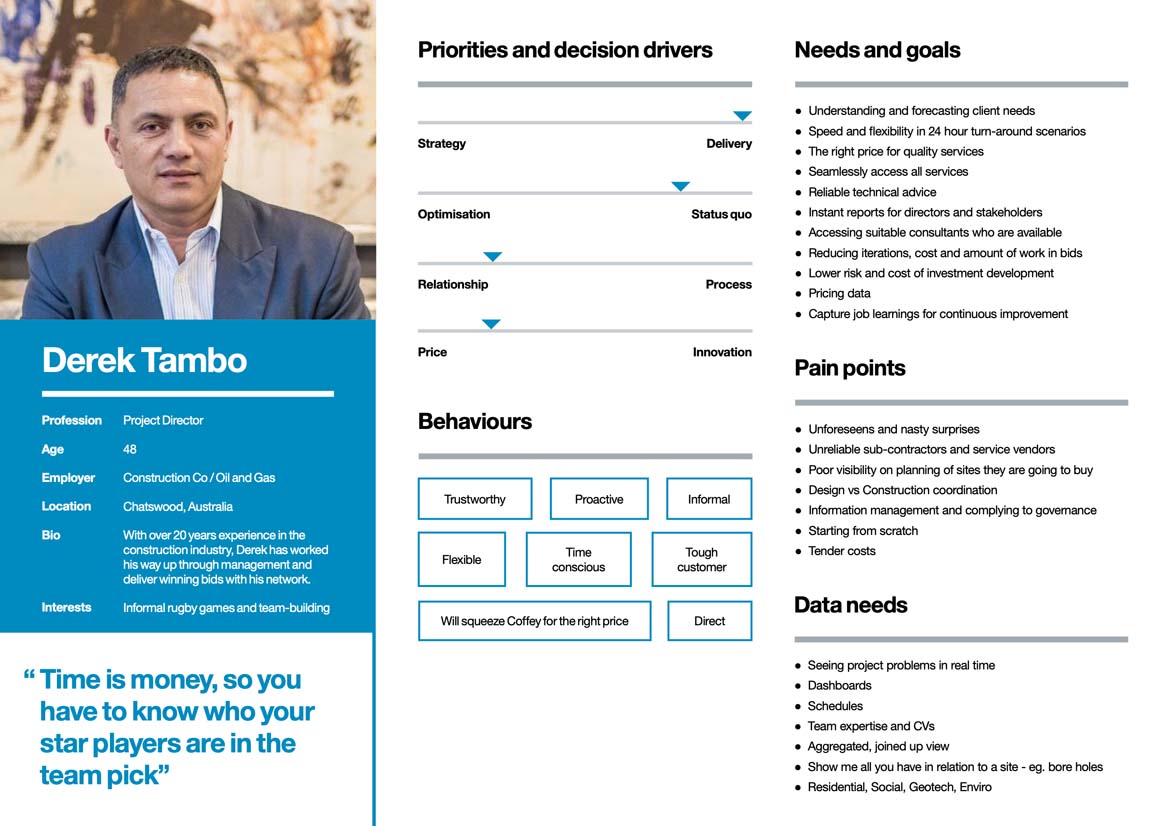
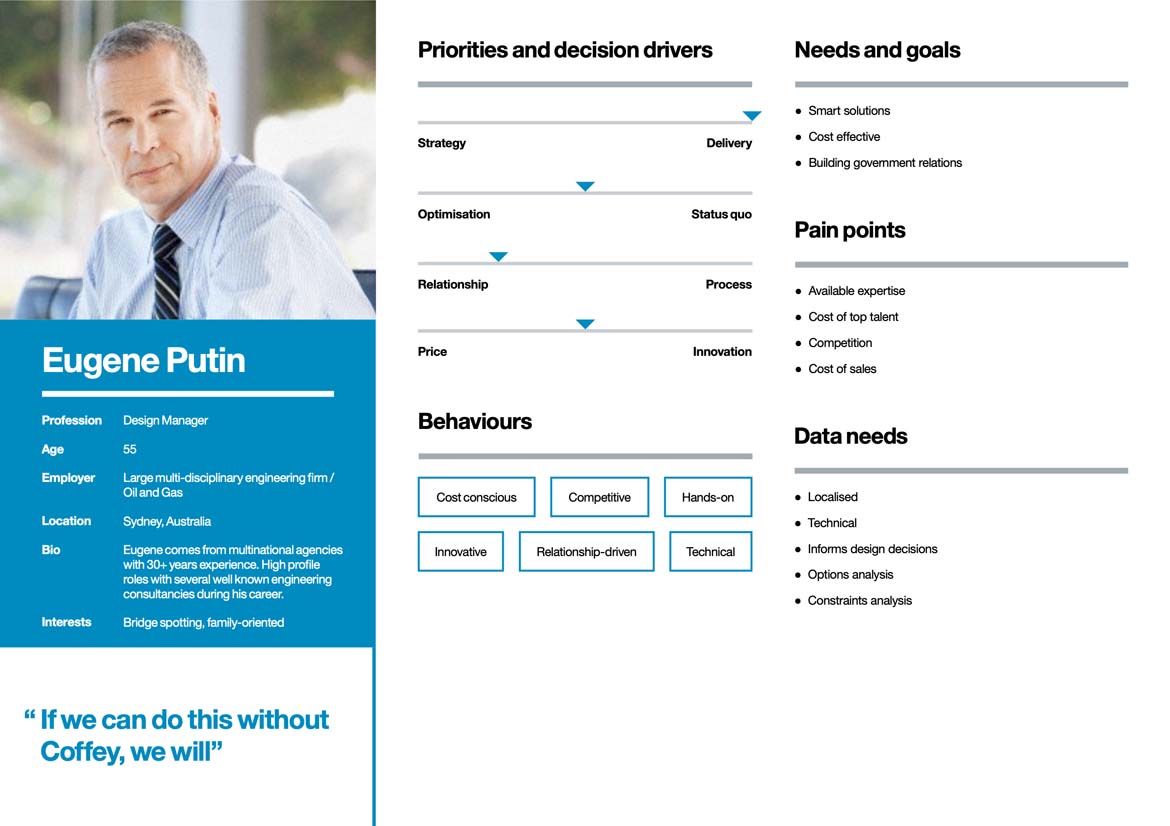
We needed to understand their prospective clients and also to keep focused on their needs and contexts. We grouped typical personas by role archetypes which made them easier to remember.
The grouping was done by profession, needs and behaviours. With the help of the internal Sales team, we used their stories to illustrate each of the persona narratives to bring them to life.
Personas were sketched together at first, and over time, they evolved to become fictional archetypes whose behaviours and needs were validated through qualitative interviews and usability testing.
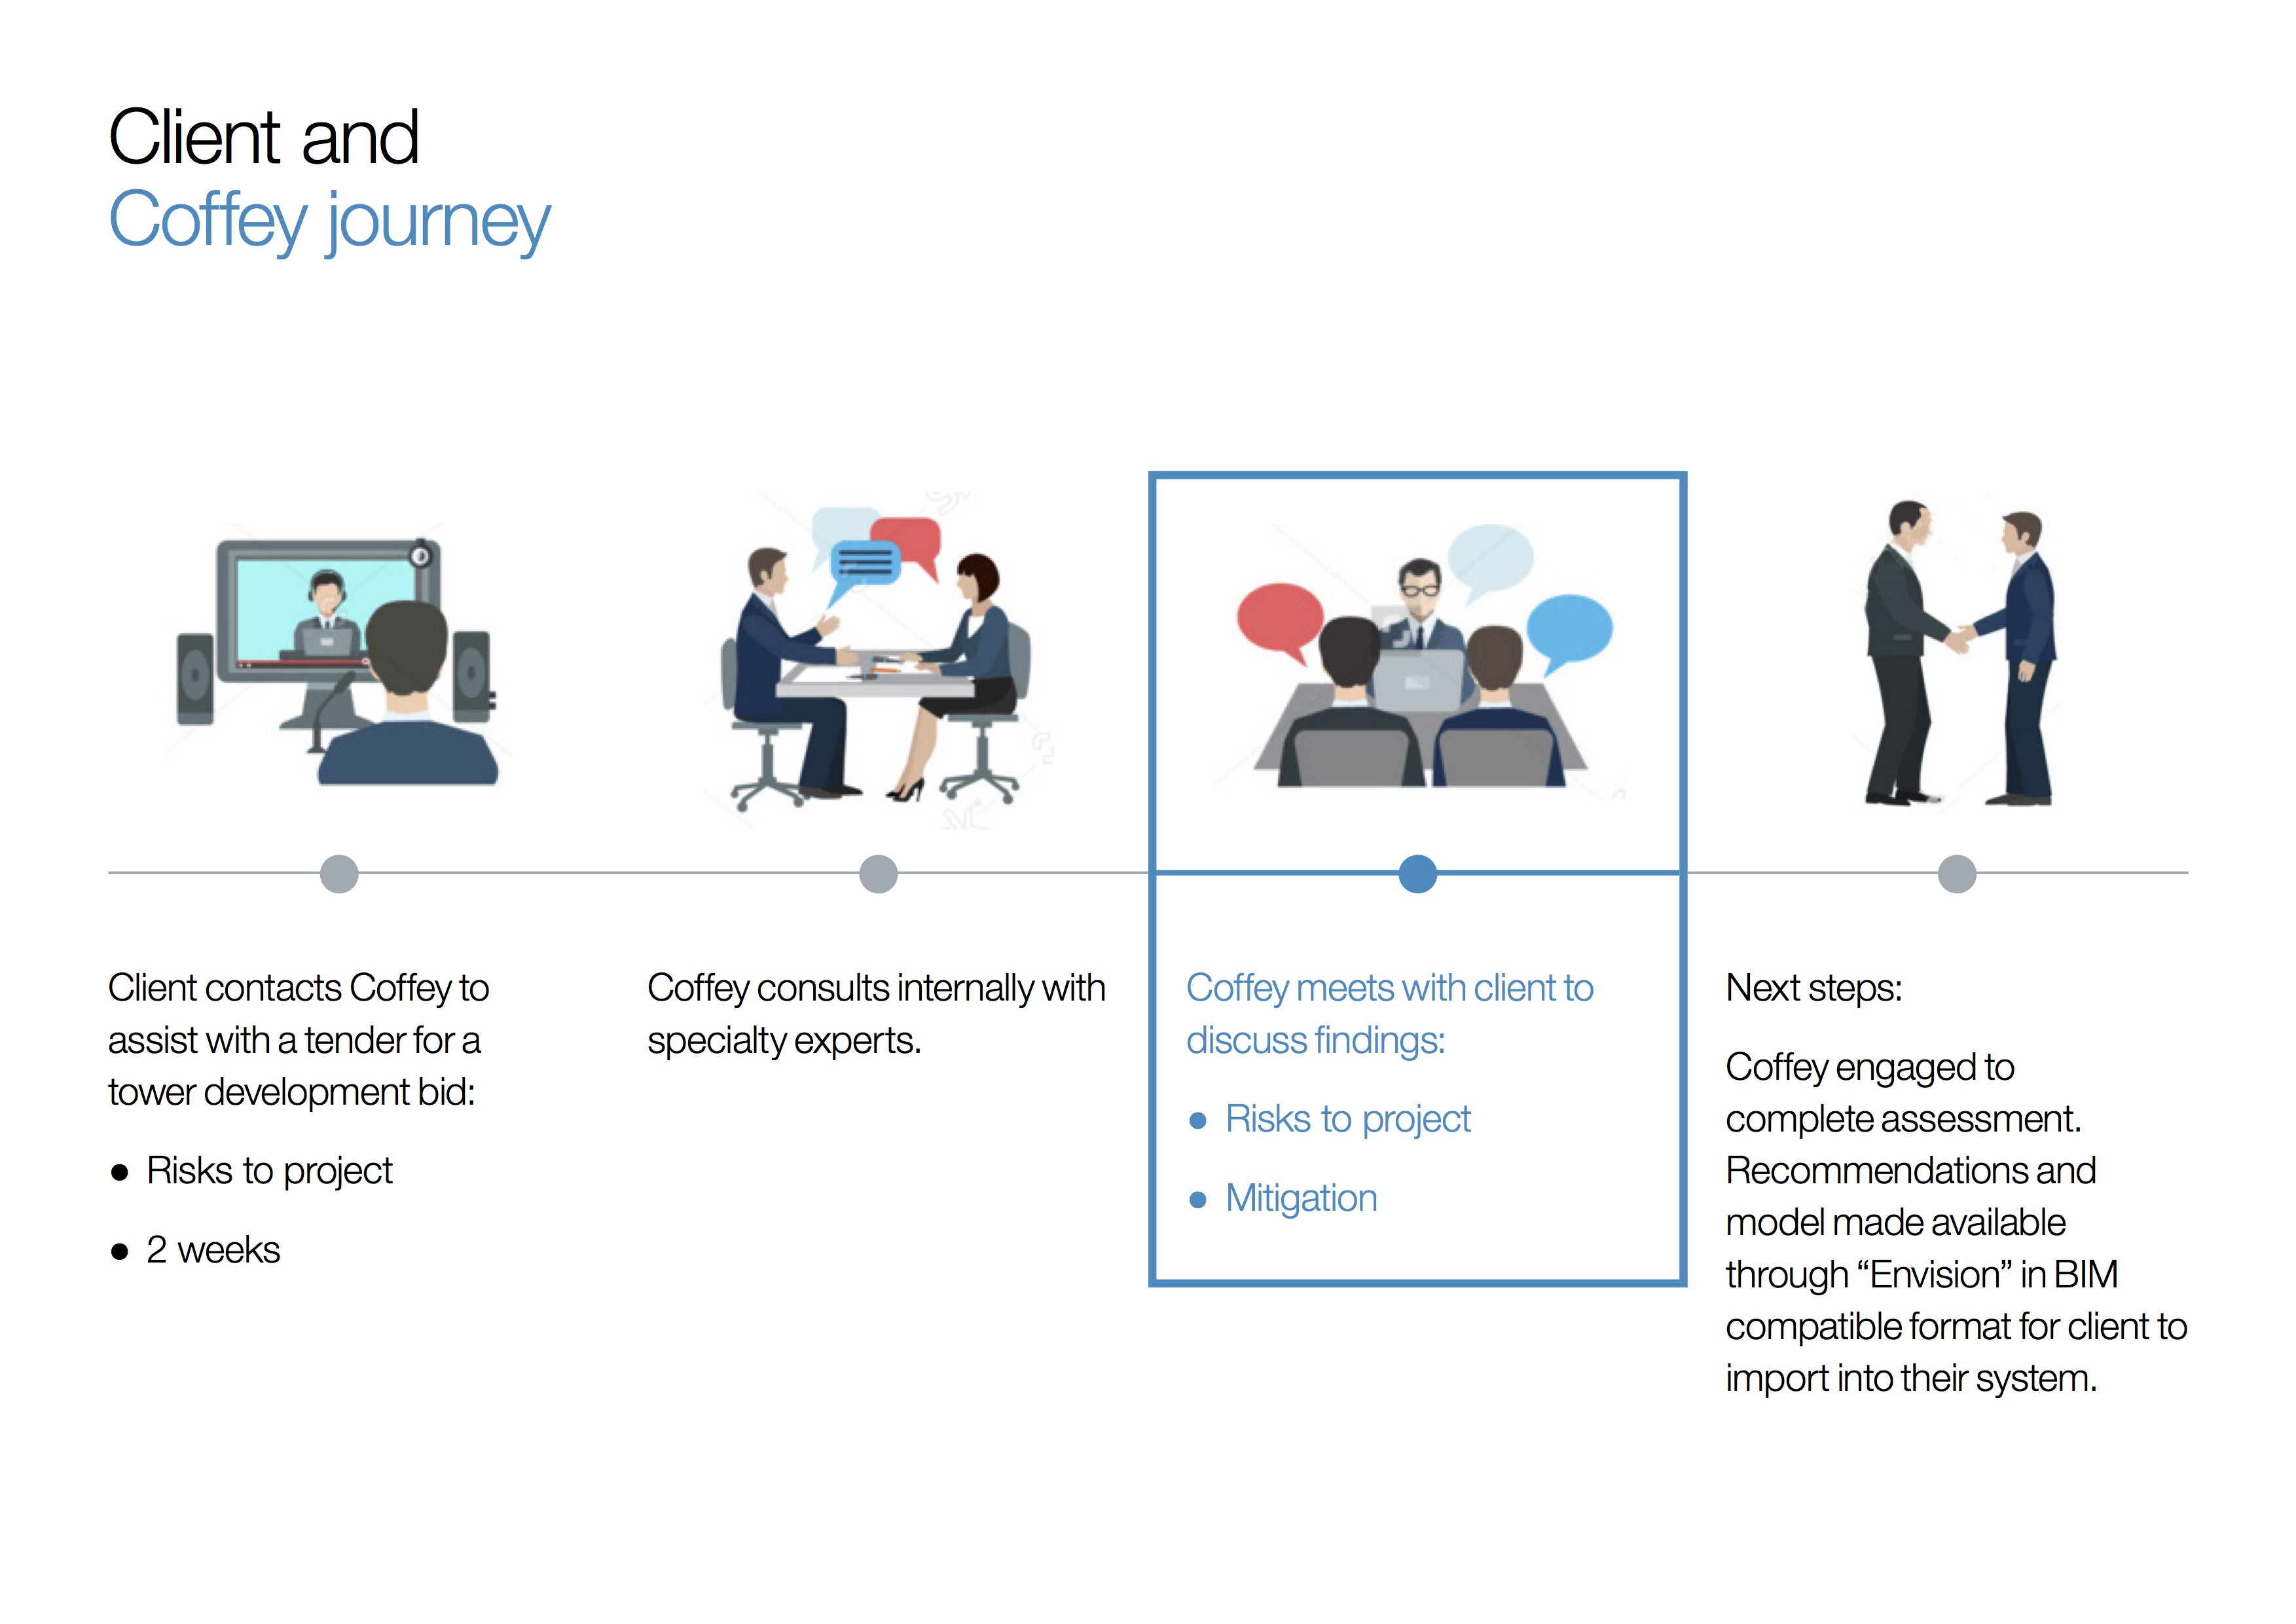
Mapping the customer journeys with task models


Once we had a handful of personas, it was time to start understanding their needs from beginning to end when it came to dealing with what the company was offering them. This is where we use customer journey maps and task models to great effect.
We used sticky notes to list each need from left to right so that we could see where each of their needs tended to occur along the journey. Needs sometimes contain tasks, which are stacked so that the journey map starts to resemble a group of towers.
We then mirror each of these tasks underneath with existing teams, procedures and systems highlighting any that were missing to match their customer needs. This was particularly important when prioritising the features of the prototype and where they needed to be present to the customers and the staff servicing them.
In effect, this was a basic service blueprint that mapped both the current state and indicated future states of what the solution needed to provide to achieve successful outcomes.
Designing the prototype


The team co-designed sketches (low-fidelity prototypes) individually to visualise the kind of solution that matched the majority of these client (as well as staff) needs.
Some people found these initial concept sketches very difficult to understand. This is where we needed to scan them into an interactive prototype so that they were able to show how useful they could be.
Geotechnical Engineers tend to exhibit risk aversion as a professional trait. This is because they are trained to reduce risk as much as possible in their industry. Understandably, the severity of problems can be disastrous when considering impacts on construction and building developments.
This risk aversion can be challenging when trying to experiment with new solutions when trying to solve a problem. To overcome this aversion, the prototype/testing method needed to be presented as an “experiment & learn” method. The benefit of this is that the risk is mitigated and reduced when building a scalable solution.


Testing the prototype
In each sprint, the prototype would develop in fidelity from sketches to designs and eventually HTML code. The more we showed our progress and talked with client managers, the more they were able to understand and contribute to the desired solution as a collaborative process.
As the prototype developed from sketches to interactive designs with higher fidelity, we observed another challenge. The more that the designs resembled a real system, the more people forgot that it was a prototype. This meant that the expectations they had of the prototype’s functionality were increasing. At that point, it was necessary to start building functionality with front-end development.
Eventually, the client managers and geotechnical experts grew more comfortable as the prototype started taking on a life of its own. It was now ready to be usability tested on their customers.
Results
The results of prototype concept testing exceeded expectations. Stakeholders were increasingly emboldened and felt that they could now start new relationships meeting the needs of their clients. The clients, once experiencing the usability tests of the prototype understood the utility of the solution and suggested enhancements and more features which was valuable feedback for everyone.
“I can see this being part of BAU (Business As Usual) for us”
“I’d make this mandatory on all our projects”
“This is gold!”
The final sprint resulted in a prototype that served all client primary needs and allowed staff to deliver data on geographical locations in an instant. Indeed, one of their largest clients had expressed such interest that the project needed to pivot.
This pivot involved a partnership with the firms in which the product would become a white-label product to use for all their clients.